By Nicole Ramos | Regional Economist, East Cascades | Oregon Employment Department
During a colder than normal January, employment losses across Central Oregon were higher than usual for this time of year. Annual benchmark revisions had minimal impact on the overall employment situation in 2023. The most significant change occurred in Jefferson County, where total nonfarm employment growth appeared to be flatter than initially estimated.
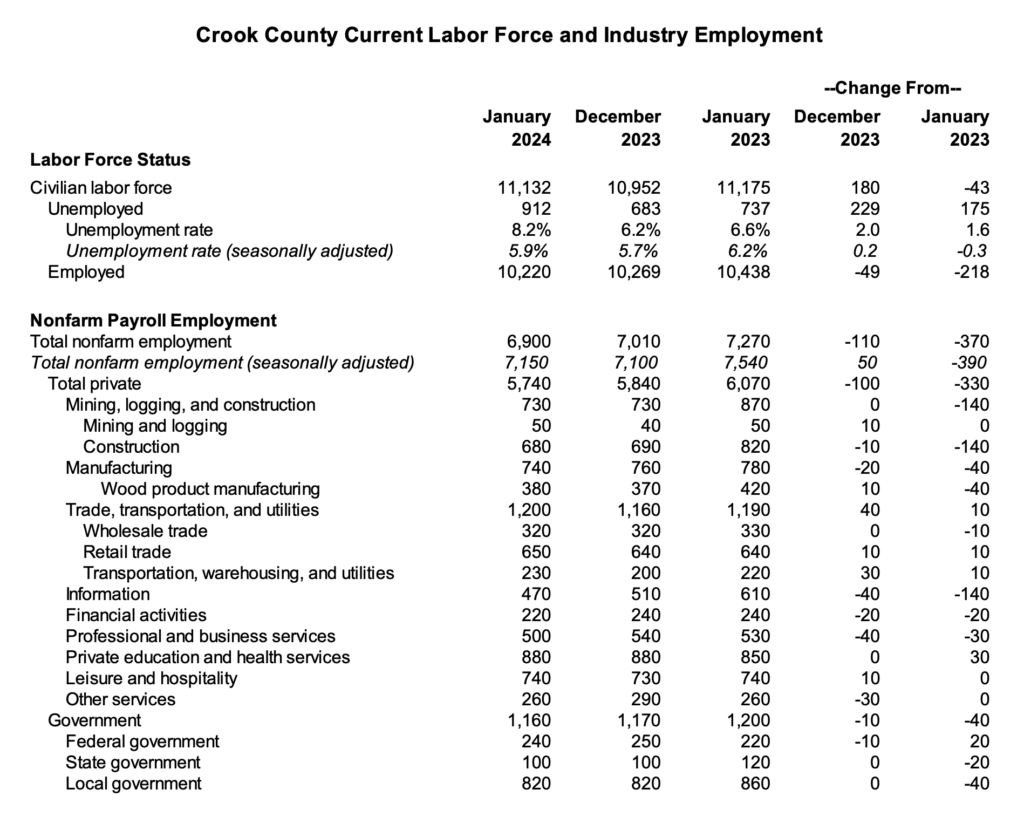
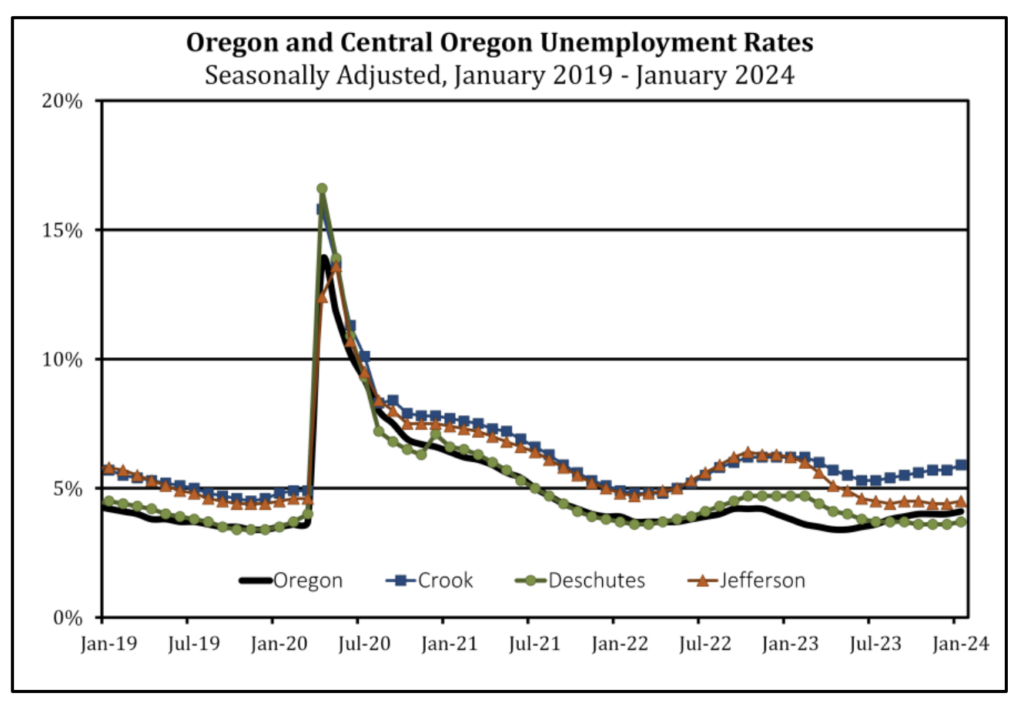 Crook County: The seasonally adjusted unemployment rate increased over the month of January and is now 5.9%—in January of last year, it was 6.2%. The unemployment rate remains 1.4 percentage points above the record low set before the pandemic when it was 4.5%.
Crook County lost 110 jobs in January, with most losses occurring in professional and business services (-40 jobs) and information (-40 jobs). Employment levels in Crook County are now 7.2% above pre- pandemic levels in February 2020 (+480 jobs).
The county lost 370 jobs in the last year (-5.1%). Job losses were concentrated in construction (-140 jobs) and information (-140 jobs). Marginal gains were concentrated in private education and health services (+30 jobs), and trade, transportation, and utilities (+10 jobs).
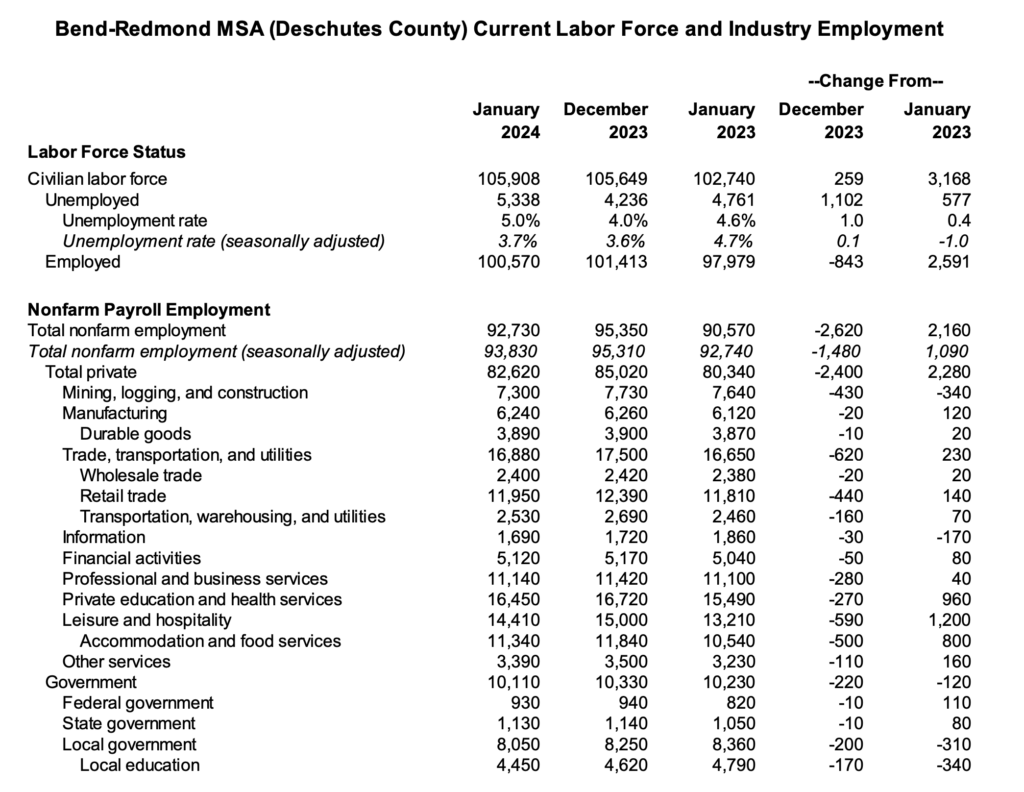
Deschutes County (Bend-Redmond MSA): The seasonally adjusted unemployment rate increased to 3.7% in January from 3.6% in December. The unemployment rate in January remains 0.3 percentage point above its record low of 3.4% before the onset of the pandemic.
The Bureau of Labor Statistics estimates that Deschutes County lost 2,620 jobs (-2.7%) from December to January. Most losses were concentrated in trade, transportation, and utilities (-620 jobs), followed by leisure and hospitality (-590 jobs), and mining, logging, and construction (-430 jobs). Total nonfarm employment is now 92,730.
Total nonfarm employment expanded by 2.4% (+2,160 jobs) from January 2023. Year-over-year job gains were concentrated in leisure and hospitality (+1,200 jobs) and private education and health services (+960 jobs). Other notable job gains took place in trade, transportation, and utilities (+230 jobs); other services (+160 jobs); and manufacturing (+120 jobs). Over-the-year losses occurred in mining, logging, and construction (-340 jobs); information (-170 jobs); and government (-120 jobs)
Revised 2023 estimates using payroll tax records are also now available. Deschutes County revisions were modest with total nonfarm employment being revised down by less than 1%.
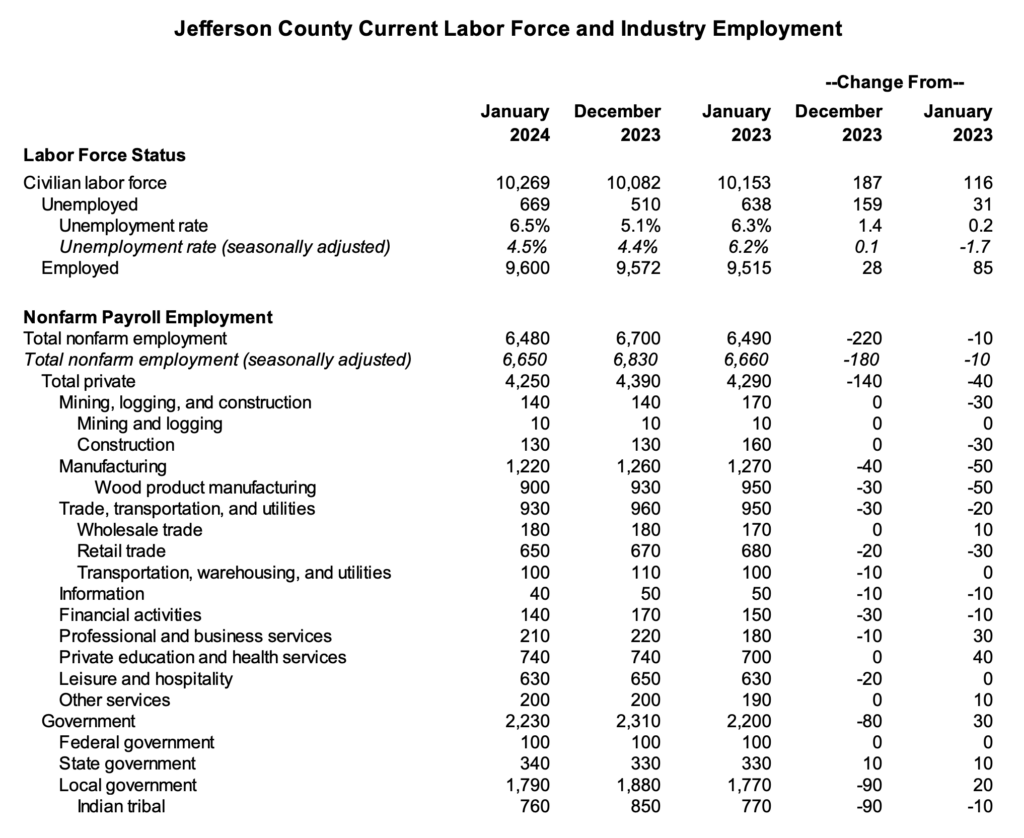
Jefferson County: The seasonally adjusted unemployment rate increased slightly over the month of January and is now 4.5%. The unemployment rate was 4.4% from October 2019 to December 2019, shortly before the first impacts from COVID-19.
Total nonfarm employment decreased by 220 jobs in January (-3.3%). Job losses were concentrated in the public sector (-80 jobs), with most losses occurring in local tribal government (-90 jobs). Other notable losses occurred in manufacturing (-40 jobs); trade, transportation, and utilities (-30 jobs); and financial activities (-30 jobs). All other industries registered little to no change over the month. Total nonfarm seasonally adjusted employment is now -0.9% (-60 jobs) below the pre-pandemic employment level.
Jefferson County’s total nonfarm employment decreased by 10 over the past year (-0.2%). Recent benchmarking revisions revealed that the recovery was slower than initially estimated in 2023. Job losses were concentrated in manufacturing (-50 jobs), construction (-30 jobs), and retail trade (-30 jobs). Gains were concentrated in private education and health services (+40 jobs); professional and business services (+30 jobs); and government (+30 jobs).
Next Press Releases
The Oregon Employment Department plans to release the February county and metropolitan area unemployment rates on Tuesday, March 26, and the statewide unemployment rate and employment survey data for February on Wednesday, March 20.
The most recent month is preliminary, the prior month is revised. Prepared in cooperation with the U.S. Department of Labor, Bureau of Labor Statistics.
Civilian labor force includes employed and unemployed individuals 16 years and older by place of residence. Employed includes payroll employment, self-employed, unpaid family workers, domestics, agriculture, and labor disputants. Unemployment rate is calculated by dividing unemployed by civilian labor force.
Nonfarm Payroll Employment: Data are by place of work and cover full- and part-time employees who worked or received pay for the pay period that includes the 12th of the month. The data exclude the self-employed, volunteers, unpaid family workers, and domestics.
The most recent month is preliminary, the prior month is revised. Prepared in cooperation with the U.S. Department of Labor, Bureau of Labor Statistics.
Civilian labor force includes employed and unemployed individuals 16 years and older by place of residence. Employed includes payroll employment, self-employed, unpaid family workers, domestics, agriculture, and labor disputants. Unemployment rate is calculated by dividing unemployed by civilian labor force.
Nonfarm Payroll Employment: Official Oregon Series. Data are by place of work and cover full- and part-time employees who worked or received pay for the pay period that includes the 12th of the month. The data exclude the self-employed, volunteers, unpaid family workers, and domestics.
The most recent month is preliminary, the prior month is revised. Prepared in cooperation with the U.S. Department of Labor, Bureau of Labor Statistics.
Civilian labor force includes employed and unemployed individuals 16 years and older by place of residence. Employed includes payroll employment, self-employed, unpaid family workers, domestics, agriculture, and labor disputants. Unemployment rate is calculated by dividing unemployed by civilian labor force.
Nonfarm Payroll Employment: Data are by place of work and cover full- and part-time employees who worked or received pay for the pay period that includes the 12th of the month. The data exclude the self-employed, volunteers, unpaid family workers, and domestics.
| The Oregon Employment Department and the U.S. Bureau of Labor Statistics (BLS) work cooperatively to develop and publish monthly payroll employment and labor force data for Oregon’s metropolitan areas and counties. The estimates of monthly job gains and losses are based on a survey of businesses. The estimates of unemployment are based on a survey of households and other sources. The Oregon Employment Department payroll employment estimates are revised quarterly using information from unemployment insurance tax records. All department publications use data from this official Oregon series unless noted. The department also makes the BLS-produced nonfarm payroll employment series for metropolitan areas available. These are revised annually by BLS. |


0 Comments