Economy in Central Oregon
By Nicole Ramos | Regional Economist, East Cascades | Oregon Employment Department
February in View:
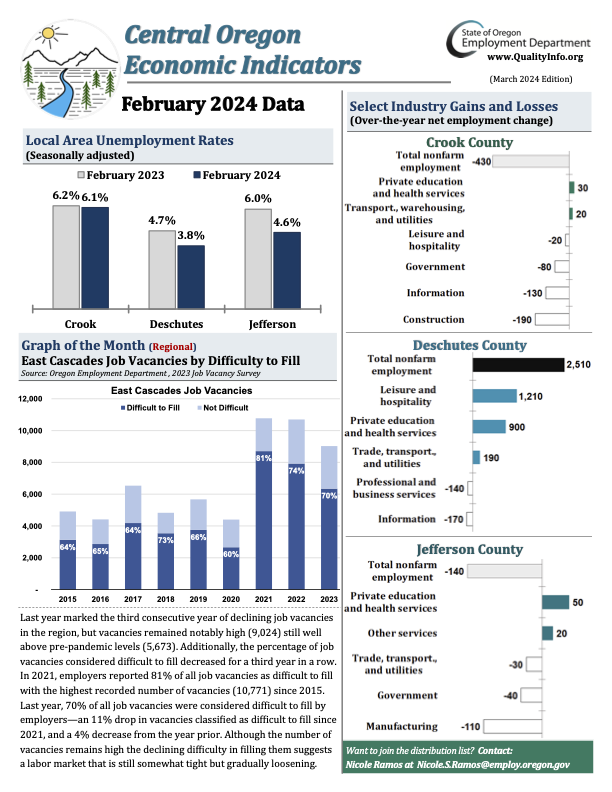
All over-the-year total nonfarm employment gains in February were concentrated in Deschutes County, with employment up by 2,510 jobs. In contrast, Crook County saw employment decrease by 430 jobs over the year, while Jefferson County saw employment decline by 140 jobs.
The nation’s seasonally adjusted unemployment rate increased slightly from 3.7% in January to 3.9% in February. At the statewide level, there was also a slight increase in the unemployment rate, going from 4.1% in January to 4.2% in February.
Like the state and nation, the seasonally adjusted unemployment rates across Central Oregon increased over the month of February. Crook County’s unemployment rate went from a revised rate of 5.8% in January to 6.1% in February; Jefferson County’s rate went from 4.5% to 4.6%; and Deschutes County’s from 3.7% to 3.8%. That said, all three counties saw a year-over-year decline in their seasonally adjusted unemployment rate.
Topic of the Month: East Cascades Job Vacancies by Difficulty to Fill
Recently, the Oregon Employment Department released the 2023 annual job vacancy survey data for the state and regions. This month’s graph highlights the number and percentage of job vacancies considered difficult to fill by employers in the East Cascades since 2015. There is a lot more 2023 annual data to delve into though. In 2023, businesses reported 9,024 total vacancies in the East Cascades region, marking a 16% decrease from the peak of 10,771 observed in 2021 at the turn of the pandemic recession when employment started to surge rapidly. The typical vacancy last year was full-time (74%), permanent (92%), and considered difficult to fill (70%). Slightly over half (55%) required previous experience, with only 34% requiring an education beyond high school. You can access regional Job Vacancy Survey data by viewing the PDF slide deck or by visiting our website. Some data highlights include education requirement metrics such as the number of vacancies and average wage by required educational attainment; the number of job vacancies, and average wage of these vacancies per industry and occupation group; and a brief overview of other regions in Oregon for a quick comparative analysis.
Articles of Interest
Earn While You Learn in a High-Wage, High-Demand Job with Apprenticeship Training by Molly Hendrickson
Top Occupations Oregon Employers Were Hiring in 2023 Job Vacancies by Jessica Nelson
Wage and Job Growth Across Many Industries by Molly Hendrickson
High-Wage Jobs in the Leisure and Hospitality Industry by Guy Tauer
Health Care Jobs Now and Into the Future by Lynn Wallis
Slow Job and Labor Force Growth: 2023 in Review by Gail Krumenauer


0 Comments